
Volume 13, Issue 3 (10-2025)
Jorjani Biomed J 2025, 13(3): 4-9 |
Back to browse issues page


Download citation:
BibTeX | RIS | EndNote | Medlars | ProCite | Reference Manager | RefWorks
Send citation to:


BibTeX | RIS | EndNote | Medlars | ProCite | Reference Manager | RefWorks
Send citation to:
Behnampour N, Naghavi S H, Khorsha H, Honarvar M R. Diet management system (SAMAR): A software for evaluating and designing the diet of Iranians. Jorjani Biomed J 2025; 13 (3) :4-9
URL: http://goums.ac.ir/jorjanijournal/article-1-1064-en.html
URL: http://goums.ac.ir/jorjanijournal/article-1-1064-en.html


1- Department of Biostatistics, Faculty of Health, Golestan University of Medical Sciences, Gorgan, Iran
2- Health Management and Social Development Research Center, Golestan University of Medical Sciences, Gorgan, Iran
3- Health Management and Social Development Research Center, Department of Nutritional Sciences, School of Health, Golestan University of Medical Sciences, Gorgan, Iran
2- Health Management and Social Development Research Center, Golestan University of Medical Sciences, Gorgan, Iran
3- Health Management and Social Development Research Center, Department of Nutritional Sciences, School of Health, Golestan University of Medical Sciences, Gorgan, Iran
Full-Text [PDF 644 kb]
(1774 Downloads)
| Abstract (HTML) (8468 Views)
Discussion and Conclusion
The results of nutrient analysis of foods are in good agreement with the results of NUT4 analysis. Therefore, the SAMAR software seems to be a suitable tool for nutritional evaluation and planning based on the cultural and social structure of Iran. We have few native software programs in this area in Iran. Leemoo dietary assessment software has been used for dietary planning in Iran and has appropriate applications, but we did not find a report comparing the analysis of the nutritional composition of its menus with other standard software (3). Nutri-Educ is a French nutrition software whose main aim is to help people evaluate their diet and balance meals. This software transforms basic foods into a balanced meal based on the user's energy needs and medical problems related to nutrition (11). NutPlan is a multilingual diet software for Eastern European and Western Balkan countries. It has several functions, including individual and group diet planning, food labelling, and nutrient intake assessment. It can be used in the food industry and is recommended for educational purposes (12). It has more applications than Leemoo. However, it does not use fuzzy logic (3). It seems that these non-Iranian software programs are not accurate enough because they are not based on Iranian conditions.
There are different experiences around the world in evaluating various software. For example, Falaise et al. analyzed the 24-hour weighted dietary records of 20 patients across five nutrition-related apps (Samsung Health, MyFitnessPal, FatSecret, Noom Coach, and Lose It!) and Dietplan6 (The reference method). The UK versions of the programs estimated energy, macronutrients (Carbohydrate, protein, fat, saturated fat, and fiber), and micronutrients (Sodium, calcium, iron, vitamin A, and vitamin C) using paired t-tests and signed-rank tests. Wilcoxon tests, correlation coefficients, and Bland-Altman analysis were used for comparison (13).
In the present study, the comparison of SAMAR with NUT4 showed that SAMAR is able to provide nutritionists and other users with appropriate results regarding dietary intake. SAMAR uses the database of Iranian foods, which makes it easier for users. If a user attempts to register Iranian foods in NUT4, they must go through a relatively complicated process to find foods equivalent to Iranian foods in the NUT4 database, and the results will still be only approximate. Overall, these differences are due to the disparity in the number of foods in each program’s database, the number of missing nutrient values, the food databases used, and the way foods are analyzed (Raw or cooked) (11).
The comparison between SAMAR and NUT4 regarding energy intake and macronutrients (Table 1) shows a high positive correlation, and both the linear coefficients and the constant value of their regression equation are significant. In the study by Wada et al., the average carbohydrate intake assessed by SSS and 24-hour recall was 210.6 ± 55.1 and 215.5 ± 52.9 g per day, respectively, with a positive correlation (r = 0.53, p < 0.001). Bland-Altman analysis showed that the range of agreement for carbohydrates between methods was -107.4 to 97.5 grams per day (7). In the Raatz study, Bland-Altman analysis showed high variability between nutrient values for energy, carbohydrate, protein, fat, saturated fat, total fiber, and sodium when comparing results from GRAND, Nutrihand, and Tap and Track software (12).
Numerous investigations have indicated that software designed for dietary intake assessment demonstrates a satisfactory level of accuracy in quantifying energy and macronutrients, which include protein, fat, and carbohydrates (6,14-16). For instance, a study evaluating the Remind software identified a strong correlation with traditional handwritten food diaries when measuring energy and macronutrient intake. The accuracy of this software was further validated through statistical analyses such as the Bland-Altman test and Pearson correlation (15). Among the students, the Ghithaona software exhibited no significant deviation from the 3-Day Food Record method in its assessment of energy and macronutrients, with the correlation between the two methodologies falling within an acceptable range (0.261 to 0.58) (14). While the Keenoa software revealed some discrepancies compared to traditional methods, particularly regarding fats and carbohydrates, its collective data remained suitable for broader analytical purposes (16).
Conversely, the evaluation of micronutrients-including iron, zinc, and vitamins B and C-by these software programs poses more substantial challenges. The performance of Remind software in assessing micronutrients was found to be lacking; for example, considerable discrepancies were noted in the levels of iron, zinc, and certain vitamins compared to conventional methods. This may stem from difficulties associated with accurately quantifying these nutrients in mixed dishes (15). Similarly, the Keenoa software also displayed variances from traditional approaches when it came to micronutrients like iron and potassium (16). Such limitations might arise from inadequate accuracy in the software's food database or potential user mistakes in recording food items. While dietary intake assessment software shows commendable precision in measuring energy and macronutrients, it still requires enhancements for the accurate assessment of micronutrients and mixed foods. Integrating these software tools with advanced technologies and more precise databases could significantly bridge the gap between contemporary and traditional assessment methods.
This study has several limitations, including a small sample size, differences in the data centers for SAMAR and NUT4, and the lack of assessment of all nutrients, as well as user-friendliness and simplicity. To accurately determine the precision and effectiveness of SAMAR, it is essential to conduct broader and more comprehensive studies.
The SAMAR software is a suitable program in terms of ease and smoothness of use, as it has gone through several stages of implementation in the field of educational internships and, based on this experience, has responded appropriately to the corrections requested by users. Furthermore, by using Iranian databases, this software has shown good compatibility with Iranian conditions. It also offers flexibility to add local foods and has demonstrated good agreement and capabilities compared to NUT4 software.
Key progress
SAMAR is not merely another nutritional tool - it represents a validated, culturally relevant innovation that addresses a significant gap in nutritional assessment for Iran, merging scientific rigor with local applicability.
Acknowledgement
We wish to convey our sincere appreciation to the distinguished Vice Chancellor for Research, as well as to our colleagues in the Information Technology Department at Golestan University of Medical Sciences, and to the administrators of Deziani Clinic, for their invaluable assistance in this research.
Funding sources
This research was funded by Golestan University of Medical Sciences, Iran.
Ethical statement
Ethical approval was granted by the Research Ethics Committee of Golestan University of Medical Sciences with the following specifications: IR.GOUMS.REC.1399.356.
Conflicts of interest
The authors declare that they have no conflicts of interest.
Author contributions
MRH and SHN were software designers. MRH, NB, and HK were responsible for conceptualization, methodology, analysis, manuscript writing, and review and editing. All authors read and approved the final manuscript.
Data availability statement
The datasets utilized and/or analyzed in this study can be obtained from the corresponding author upon reasonable request.
Full-Text: (231 Views)
Introduction
Nutritional assessment of patients, as a basic step in the nutritional care process, is an important step to identify possible deficiencies in people's nutritional intake and to start designing effective nutritional interventions (1). The assessment and design of an appropriate diet play a key role in promoting individual health and preventing nutrition-related diseases. However, traditional methods of assessing food intake, such as food frequency questionnaires and food recalls, have several limitations. These include a high reporting burden, memory errors, and limitations in FCDBs (2). There are several ways to assess the nutritional intake of patients. Clients report all the foods and beverages they consume by estimating the portion size using household measures in an interview with the interviewer, or by recording it on the appropriate form. Once dietary intake data have been collected, they should be analyzed for macronutrient and micronutrient content to compare with existing dietary recommendations and to assess their adequacy. The assessment of current dietary intakes and the planning of food menus for individuals and groups is a complex and time-consuming task that researchers have been trying to computerize since the early 1960s (3). New technologies, including web-based software and mobile applications, can overcome these limitations by providing researchers and nutritionists with more accurate and efficient data (4). For this, a database of food composition is needed as a basis for assessing nutrient content. The accuracy of the dietary analysis process depends on the quality of the FCDB used, regardless of the dietary assessment method (1). Dietary analysis software is often used to facilitate the process of searching FCDBs. The software should allow the user to enter the type and amount of food consumed so that the estimated nutrient intake (Including macronutrients and micronutrients) is calculated and compared with the standards for the same person in the same age and sex group. The software should also help to adjust the diet based on portion size and suggest the amount of food to be consumed to meet macronutrient and micronutrient requirements.
It is better for each country to have its own databases based on local conditions. Many countries provide their own national databases to supply data on the composition of foods commonly consumed by the indigenous population. In the United States, the US Department of Agriculture National Nutrient Database for Standard Reference and the Food and Nutrient Database for Dietary Studies are the main nutrient databases used and the primary sources of food composition data. In France, CIQUAL is used, and in England, the combined FCDB by McCance and Widdowson is utilized to analyze commonly consumed foods (1). WebDASC is a software program for Danish children (5), and the PIQNIQ app records food intake in the US (6). Large databases such as foodDB, which use big data technologies, have enabled continuous updates to food composition information in the UK (7).
Some nutrient data analysis software is part of a broader software platform. This software can provide medical nutrition therapy management, diet planning, and analysis of food nutrient information (8). Dietary analysis programs use software that makes it easy to track dietary intake by analyzing the composition of each meal and the nutrients consumed. The use of such software is an important step in calculating the nutrients consumed from a person's dietary intake. Dietitians can use the software to track nutrient intake, set dietary goals, and plan meals (8).
Some key challenges encountered with Western nutrition software, such as Nutritionist 4 (NUT4), include the absence of a database for Iranian foods, differences in agricultural practices (Such as the varieties of wheat, rice, and dairy), cultural eating habits (For instance, traditional dishes like Qorme Sabzi are not included in the software), and issues with language and usability (The software is not optimized for Persian users).
Due to the diversity of regions and cultures, Iran has its own foods and raw materials. Therefore, it is essential to create a database containing a wide range of traditional Iranian products and foods.
Several software programs developed in different countries are currently used in Iran (Such as NutPlan, Nutri-Educ, the Iran Food Consumption Program (IFCP), and Leemoo software). They still do not cover many common Iranian dishes. Therefore, there is a need to develop new software that reflects the foods and nutrients consumed in Iran.
Methods
Diet management system (SAMAR) database
The SAMAR database contains the food database taken from the Iranian food composition table. The FCDB contains 733 Iranian foods. Each food includes essential components such as energy, macronutrients, and micronutrients, up to 65 nutrients (9). Food quantities are given in grams and in common household sizes. The source of the non-Iranian food database is FNDDS 2017-2018 from the United States Department of Agriculture (10). Common Iranian homemade dishes or local dishes such as stews and casseroles are added to the combined dishes section of SAMAR (Including 252 dishes). It is possible for users to add new local foods to the combined foods section, and the nutritional value of these foods is automatically calculated from the SAMAR database.
This software has educational and research applications, as well as dietary assessment and planning. At first, information is collected, including personal characteristics such as name, age, sex, weight, height, and medical, pharmaceutical, and laboratory records. The pharmaceutical section gives the user access to information on food and drug interactions. The energy calculation and macronutrient distribution section are then provided to the user, and finally the user can design and provide the daily diet based on each person's specific conditions. The calculations in this section are adapted according to conditions such as kidney disease or pregnancy. The recommendations section also provides the user with appropriate information based on the patient's specific conditions and diseases to add to the patient's diet plan. If the user deems it necessary, they can also provide the patient with a description of the composition of the foods mentioned in the suggested diet (Such as the variety of bread and the serving sizes for each item.) (Figures 1 and 2).
The SAMAR software uses Dietary Reference Intakes (DRIs) to estimate nutrient requirements based on gender and age groups. The evaluation section of the SAMAR software has two subsections: the food frequency questionnaire and the 24-hour recall. By completing each of these, the user can access the analysis of dietary intakes and compare them with the DRI standards (Figure 3).
 Figure 1. Calculating and downloading the results of the analysis of food frequency and 24-hour recall in the SAMAR system (The icon for downloading the file in Excel format is visible above the tables). This patient claimed that she only consumes two handfuls of Lavash bread per year, but she consumes one handful of Barbary bread every day, three handful of Sangak bread every week, and one handful of Tafton bread every month |
 Figure 2. The image and portion size of each food are shown in SAMAR to help the patients better understand the amounts of food eaten in the meal  Figure 3. Patient profile section, links to tests, medications, and food frequency and 24-hour recall forms in the SAMAR system. The arrow indicates the Food Frequency Questionnaire form |
Students or researchers can use this section to carry out various studies in the field of evaluating patients' food intake and comparing it with standards such as DRIs. The food composition analysis Excel files of the 24-hour recall or food frequency questionnaire contain DRIs of the same age and sex group. Thus, by comparing the patient's intake with the DRI standards, one can properly analyze the patient's food intake status. This file can be imported into various software such as R or SPSS for statistical analysis.
In order to evaluate the agreement between the measurement of energy, macronutrients, and micronutrients, the results of 30 patients using the SAMAR software and NUT4 software (As a common standard software) were compared (Ethical Code: IR.GOUMS.REC.1399.356). The patients were individuals who had referred to the Nutrition Unit of the Deziani Polyclinic of Golestan University of Medical Sciences and received nutritional services. Data were collected via in-person interviews utilizing questions from the SAMAR software directed at research participants. Following the input of the data, a comparison was conducted between the results yielded by the two software programs. To compare the results, correlation coefficients, a linear regression model, and a Bland-Altman diagram were employed. The normality of the data was assessed using the Shapiro-Wilk test. The correlation of the normal data set with Pearson's linear correlation coefficient and the correlation of the non-normal data set with Spearman's correlation coefficient were reported. Once the requisite conditions had been met, the relationship between the values obtained from NUT4 and SAMAR was modeled using a linear regression model. This enabled the prediction of NUT4 values based on the values obtained from SAMAR. A Bland-Altman diagram was employed to ascertain the degree of concordance between the results of the two software programs in measuring the values.
Results
The results are summarized in Table 1. To compare energy or any nutrient in the SAMAR software, S numbers in the SAMAR software and N numbers in Nutritionist 4 software are given in the formula (For example, S1 in SAMAR is equivalent to N40 in Nutritionist 4, i.e., both represent energy).
In terms of energy, the results showed a direct relationship between the values obtained from SAMAR and NUT4, with the Pearson correlation coefficient calculated as 0.858 (P-value < 0.0001). To predict the energy values using the Nutritionist 4 software, the values obtained from the SAMAR software were subjected to linear, quadratic, and cubic regression modeling, with the linear model exhibiting an appropriate coefficient of determination (R² = 0.736). The model was subsequently presented:

The angle coefficient of the regression line, close to one, indicates greater agreement between the values obtained from the two software programs.
Using the Bland-Altman chart, Bias = 2.25 and Std. Deviation = 16.05, the upper and lower limits of the confidence interval indicate strong agreement between the results of the two software programs in measuring protein. However, for energy, the values of Bias = 207.70 and Std. Deviation = 268.00 indicate moderate agreement between the two software programs (Figure 4).
In order to evaluate the agreement between the measurement of energy, macronutrients, and micronutrients, the results of 30 patients using the SAMAR software and NUT4 software (As a common standard software) were compared (Ethical Code: IR.GOUMS.REC.1399.356). The patients were individuals who had referred to the Nutrition Unit of the Deziani Polyclinic of Golestan University of Medical Sciences and received nutritional services. Data were collected via in-person interviews utilizing questions from the SAMAR software directed at research participants. Following the input of the data, a comparison was conducted between the results yielded by the two software programs. To compare the results, correlation coefficients, a linear regression model, and a Bland-Altman diagram were employed. The normality of the data was assessed using the Shapiro-Wilk test. The correlation of the normal data set with Pearson's linear correlation coefficient and the correlation of the non-normal data set with Spearman's correlation coefficient were reported. Once the requisite conditions had been met, the relationship between the values obtained from NUT4 and SAMAR was modeled using a linear regression model. This enabled the prediction of NUT4 values based on the values obtained from SAMAR. A Bland-Altman diagram was employed to ascertain the degree of concordance between the results of the two software programs in measuring the values.
Results
The results are summarized in Table 1. To compare energy or any nutrient in the SAMAR software, S numbers in the SAMAR software and N numbers in Nutritionist 4 software are given in the formula (For example, S1 in SAMAR is equivalent to N40 in Nutritionist 4, i.e., both represent energy).
In terms of energy, the results showed a direct relationship between the values obtained from SAMAR and NUT4, with the Pearson correlation coefficient calculated as 0.858 (P-value < 0.0001). To predict the energy values using the Nutritionist 4 software, the values obtained from the SAMAR software were subjected to linear, quadratic, and cubic regression modeling, with the linear model exhibiting an appropriate coefficient of determination (R² = 0.736). The model was subsequently presented:
The angle coefficient of the regression line, close to one, indicates greater agreement between the values obtained from the two software programs.
Using the Bland-Altman chart, Bias = 2.25 and Std. Deviation = 16.05, the upper and lower limits of the confidence interval indicate strong agreement between the results of the two software programs in measuring protein. However, for energy, the values of Bias = 207.70 and Std. Deviation = 268.00 indicate moderate agreement between the two software programs (Figure 4).
|
Table 1. Correlation coefficient and linear regression equation of macronutrients and micronutrients between SAMAR and NUT4 software
 * According to the linear regression model, all associations were significant. For fat, cholesterol, and riboflavin, the distribution was not normal; therefore, Spearman's correlation coefficient was used. For vitamin B6 and vitamin C, according to the linear regression model, the constant value was not significant, but the line angle coefficient was significant. For sodium, the Spearman and regression coefficients were not significant. S_2 in SAMAR is equivalent to N_2 in Nutritionist 4, i.e., both are protein 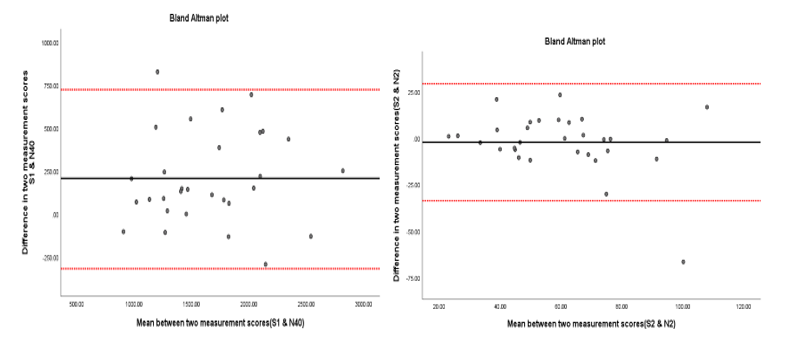 Figure 4. Bland-Altman diagram for energy (Left) and carbohydrates (Right) in SAMAR and NUT4 software |
Discussion and Conclusion
The results of nutrient analysis of foods are in good agreement with the results of NUT4 analysis. Therefore, the SAMAR software seems to be a suitable tool for nutritional evaluation and planning based on the cultural and social structure of Iran. We have few native software programs in this area in Iran. Leemoo dietary assessment software has been used for dietary planning in Iran and has appropriate applications, but we did not find a report comparing the analysis of the nutritional composition of its menus with other standard software (3). Nutri-Educ is a French nutrition software whose main aim is to help people evaluate their diet and balance meals. This software transforms basic foods into a balanced meal based on the user's energy needs and medical problems related to nutrition (11). NutPlan is a multilingual diet software for Eastern European and Western Balkan countries. It has several functions, including individual and group diet planning, food labelling, and nutrient intake assessment. It can be used in the food industry and is recommended for educational purposes (12). It has more applications than Leemoo. However, it does not use fuzzy logic (3). It seems that these non-Iranian software programs are not accurate enough because they are not based on Iranian conditions.
There are different experiences around the world in evaluating various software. For example, Falaise et al. analyzed the 24-hour weighted dietary records of 20 patients across five nutrition-related apps (Samsung Health, MyFitnessPal, FatSecret, Noom Coach, and Lose It!) and Dietplan6 (The reference method). The UK versions of the programs estimated energy, macronutrients (Carbohydrate, protein, fat, saturated fat, and fiber), and micronutrients (Sodium, calcium, iron, vitamin A, and vitamin C) using paired t-tests and signed-rank tests. Wilcoxon tests, correlation coefficients, and Bland-Altman analysis were used for comparison (13).
In the present study, the comparison of SAMAR with NUT4 showed that SAMAR is able to provide nutritionists and other users with appropriate results regarding dietary intake. SAMAR uses the database of Iranian foods, which makes it easier for users. If a user attempts to register Iranian foods in NUT4, they must go through a relatively complicated process to find foods equivalent to Iranian foods in the NUT4 database, and the results will still be only approximate. Overall, these differences are due to the disparity in the number of foods in each program’s database, the number of missing nutrient values, the food databases used, and the way foods are analyzed (Raw or cooked) (11).
The comparison between SAMAR and NUT4 regarding energy intake and macronutrients (Table 1) shows a high positive correlation, and both the linear coefficients and the constant value of their regression equation are significant. In the study by Wada et al., the average carbohydrate intake assessed by SSS and 24-hour recall was 210.6 ± 55.1 and 215.5 ± 52.9 g per day, respectively, with a positive correlation (r = 0.53, p < 0.001). Bland-Altman analysis showed that the range of agreement for carbohydrates between methods was -107.4 to 97.5 grams per day (7). In the Raatz study, Bland-Altman analysis showed high variability between nutrient values for energy, carbohydrate, protein, fat, saturated fat, total fiber, and sodium when comparing results from GRAND, Nutrihand, and Tap and Track software (12).
Numerous investigations have indicated that software designed for dietary intake assessment demonstrates a satisfactory level of accuracy in quantifying energy and macronutrients, which include protein, fat, and carbohydrates (6,14-16). For instance, a study evaluating the Remind software identified a strong correlation with traditional handwritten food diaries when measuring energy and macronutrient intake. The accuracy of this software was further validated through statistical analyses such as the Bland-Altman test and Pearson correlation (15). Among the students, the Ghithaona software exhibited no significant deviation from the 3-Day Food Record method in its assessment of energy and macronutrients, with the correlation between the two methodologies falling within an acceptable range (0.261 to 0.58) (14). While the Keenoa software revealed some discrepancies compared to traditional methods, particularly regarding fats and carbohydrates, its collective data remained suitable for broader analytical purposes (16).
Conversely, the evaluation of micronutrients-including iron, zinc, and vitamins B and C-by these software programs poses more substantial challenges. The performance of Remind software in assessing micronutrients was found to be lacking; for example, considerable discrepancies were noted in the levels of iron, zinc, and certain vitamins compared to conventional methods. This may stem from difficulties associated with accurately quantifying these nutrients in mixed dishes (15). Similarly, the Keenoa software also displayed variances from traditional approaches when it came to micronutrients like iron and potassium (16). Such limitations might arise from inadequate accuracy in the software's food database or potential user mistakes in recording food items. While dietary intake assessment software shows commendable precision in measuring energy and macronutrients, it still requires enhancements for the accurate assessment of micronutrients and mixed foods. Integrating these software tools with advanced technologies and more precise databases could significantly bridge the gap between contemporary and traditional assessment methods.
This study has several limitations, including a small sample size, differences in the data centers for SAMAR and NUT4, and the lack of assessment of all nutrients, as well as user-friendliness and simplicity. To accurately determine the precision and effectiveness of SAMAR, it is essential to conduct broader and more comprehensive studies.
The SAMAR software is a suitable program in terms of ease and smoothness of use, as it has gone through several stages of implementation in the field of educational internships and, based on this experience, has responded appropriately to the corrections requested by users. Furthermore, by using Iranian databases, this software has shown good compatibility with Iranian conditions. It also offers flexibility to add local foods and has demonstrated good agreement and capabilities compared to NUT4 software.
Key progress
SAMAR is not merely another nutritional tool - it represents a validated, culturally relevant innovation that addresses a significant gap in nutritional assessment for Iran, merging scientific rigor with local applicability.
Acknowledgement
We wish to convey our sincere appreciation to the distinguished Vice Chancellor for Research, as well as to our colleagues in the Information Technology Department at Golestan University of Medical Sciences, and to the administrators of Deziani Clinic, for their invaluable assistance in this research.
Funding sources
This research was funded by Golestan University of Medical Sciences, Iran.
Ethical statement
Ethical approval was granted by the Research Ethics Committee of Golestan University of Medical Sciences with the following specifications: IR.GOUMS.REC.1399.356.
Conflicts of interest
The authors declare that they have no conflicts of interest.
Author contributions
MRH and SHN were software designers. MRH, NB, and HK were responsible for conceptualization, methodology, analysis, manuscript writing, and review and editing. All authors read and approved the final manuscript.
Data availability statement
The datasets utilized and/or analyzed in this study can be obtained from the corresponding author upon reasonable request.
Editorial: Original article |
Subject:
Bio-statistics
Received: 2025/03/5 | Accepted: 2025/07/28 | Published: 2025/09/17
Received: 2025/03/5 | Accepted: 2025/07/28 | Published: 2025/09/17
References
1. Naaman RK, Almasaudi A, Albajri E, Naseeb M. Current use of food composition database and dietary analysis software in Saudi Arabia: A review study. J Food Compost Anal. 2023;123:105598. [View at Publisher] [DOI] [Google Scholar]
2. Dao MC, Subar AF, Warthon-Medina M, Cade JE, Burrows T, Golley RK, et al. Dietary assessment toolkits: an overview. Public Health Nutr. 2019;22(3):404-18. [View at Publisher] [DOI] [PMID] [Google Scholar]
3. Ejtahed HS, Sarsharzadeh MM, Mirmiran P, Asghari G, Yuzbashian E, Azizi F. Leemoo, a Dietary Assessment and Nutritional Planning Software, Using Fuzzy Logic. Int J Endocrinol Metab. 2013;11(4):e10169. [View at Publisher] [DOI] [PMID] [Google Scholar]
4. Eldridge AL, Piernas C, Illner AK, Gibney MJ, Gurinović MA, De Vries JHM, et al. Evaluation of New Technology-Based Tools for Dietary Intake Assessment-An ILSI Europe Dietary Intake and Exposure Task Force Evaluation. Nutrients. 2019;11(1):55. [View at Publisher] [DOI] [PMID] [Google Scholar]
5. Biltoft-Jensen A, Trolle E, Christensen T, Islam N, Andersen LF, Egenfeldt-Nielsen S, et al. WebDASC: a web-based dietary assessment software for 8-11-year-old Danish children. J Hum Nutr Diet. 2014;27(s1):43-53. [View at Publisher] [DOI] [PMID] [Google Scholar]
6. Blanchard CM, Chin MK, Gilhooly CH, Barger K, Matuszek G, Miki AJ, et al. Evaluation of PIQNIQ, a Novel Mobile Application for Capturing Dietary Intake. J Nutr. 2021;151(5):1347-56. [View at Publisher] [DOI] [PMID] [Google Scholar]
7. Harrington RA, Adhikari V, Rayner M, Scarborough P. Nutrient composition databases in the age of big data: foodDB, a comprehensive, real-time database infrastructure. BMJ Open. 2019;9(6):e026652. [View at Publisher] [DOI] [PMID] [Google Scholar]
8. Stein K. It All Adds Up: Nutrition Analysis Software Can Open the Door to Professional Opportunities. J Am Diet Assoc. 2011;111(5):S31-5. [View at Publisher] [DOI] [PMID] [Google Scholar]
9. Dorosty AR, Tabatabaee M. Jadval-e Tarkibat-e Mavad-e Ghazaie (Table of Food Composition) .Tehran: Nashr-e Daneshgahi World of Nutrition; 2007. [view at Publisher]
10. Food Surveys Research Group. Food and Nutrient Database for Dietary Studies (FNDDS) . Food Surveys Research Group, Beltsville Human Nutrition Research Center; 2017. [View at Publisher] [Google Scholar]
11. D LEE R, Nieman DC, Rainwater M. Comparison of eight microcomputer dietary analysis programs with the USDA Nutrient Data Base for Standard Reference. J Am Diet Assoc.1995;95(8):858-67. [View at Publisher] [DOI] [PMID] [Google Scholar]
12. Raatz SK, Scheett AJ, Johnson LK, Jahns L. Validity of Electronic Diet Recording Nutrient Estimates Compared to Dietitian Analysis of Diet Records: Randomized Controlled Trial. J Med Internet Res. 2015;17(1):e21. [View at Publisher] [DOI] [PMID] [Google Scholar]
13. Fallaize R, Franco RZ, Pasang J, Hwang F, Lovegrove JA. Popular Nutrition-Related Mobile Apps: An Agreement Assessment Against a UK Reference Method. JMIR MHealth and UHealth. 2019;7(2):e9838. [View at Publisher] [DOI] [PMID] [Google Scholar]
14. Hattab S, Badrasawi M, Anabtawi O, Zidan S. Development and validation of a smartphone image-based app for dietary intake assessment among Palestinian undergraduates. Sci Rep. 2022;12(1):15467. [View at Publisher] [DOI] [PMID] [Google Scholar]
15. Ramírez-Contreras C, Farran-Codina A, Zerón-Rugerio MF, Izquierdo-Pulido M. Relative Validity and Reliability of the Remind App as an Image-Based Method to Assess Dietary Intake and Meal Timing in Young Adults. Nutrients. 2023;15(8):1824. [View at Publisher] [DOI] [PMID] [Google Scholar]
16. Ji Y, Plourde H, Bouzo V, Kilgour RD, Cohen TR. Validity and Usability of a Smartphone Image-Based Dietary Assessment App Compared to 3-Day Food Diaries in Assessing Dietary Intake Among Canadian Adults: Randomized Controlled Trial. JMIR Mhealth Uhealth. 2020;8(9):e16953. [View at Publisher] [DOI] [PMID] [Google Scholar]
| Rights and permissions | |
 |
This work is licensed under a Creative Commons Attribution-NonCommercial 4.0 International License. |
